Saturday, November 27, 2021

A sense of Deja Vu

The last time I updated this blog was in March 2020, when the First Wave of Covid made landfall and the global markets fell sharply. What came next was one of the sharpest bull runs in recent times that has lasted for the best part of 20 months now. 

I must admit, I missed to invest during the first few months of this bull run!

Just as the news of a new variant of the virus started to make headlines, and to add to that, increased infections in many countries in Europe, the markets started to correct sharply.

But everything's not as sudden as it looks. Foreign investors have been selling in bigger quantities ever since early October without moving the markets that much. And they have accelerated their selling in November.

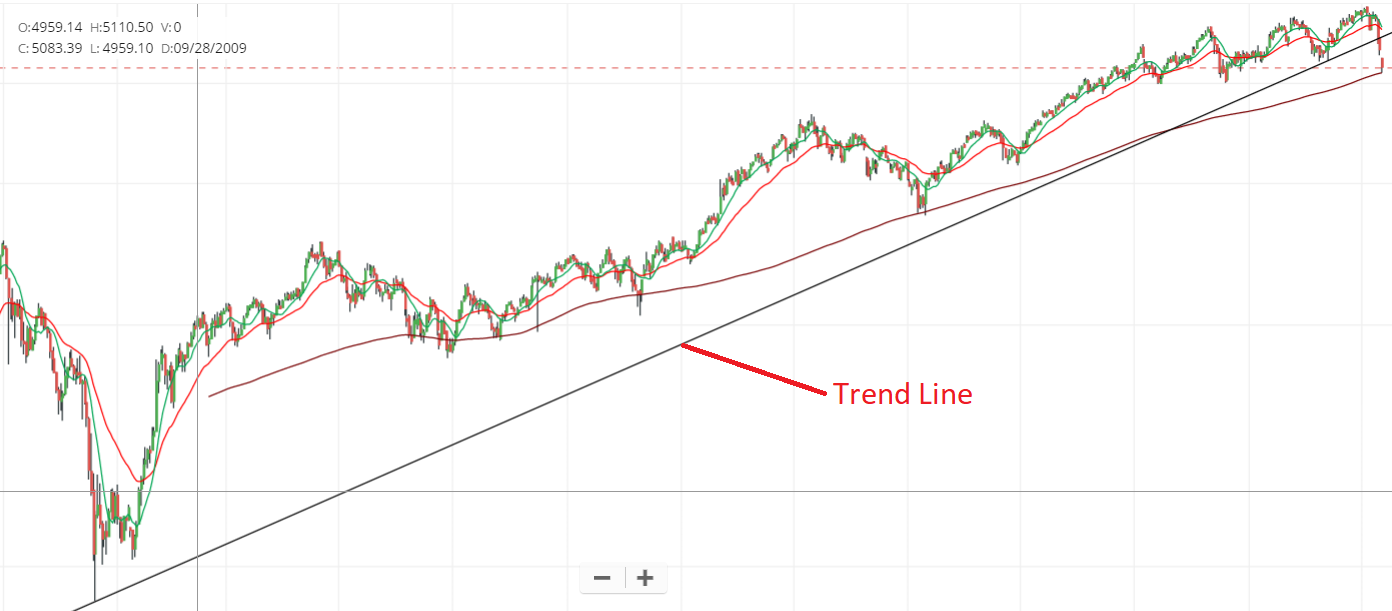
Market patterns repeat. That's because human nature has been the same for thousands of years now.

“All through time, people have basically acted and reacted the same way in the market as a result of greed, fear, ignorance, and hope. That is why the numerical formations and patterns recur on a constant basis. Over and over, with slight variations. Because markets are driven by humans and human nature never changes.”

― Jesse Lauriston Livermore

Which is why the same pattern that I had put out in my last post has repeated itself.

The uptrend formed over the last 20 months may see a correction in the days, weeks and maybe months to come. All the 3 criteria that define a trend change have occured on the charts.

What should we do next? 

That is the intent of this post!

I've read numerous articles which suggest that post lockdown, a record number of new demat accounts have been opened across India. Chances are very high that a big part of this group hasn't seen a major correction or a bear market yet! 

Some tips:

1. From my previous post, I'd like to continue the same line, "Don't go and buy some yet!"

Things shall get worse before they can get better.

2. If you have good profits from your investments, consider taking partial profits and sit on cash for sometime.

3. If you don't have bigger profits yet, or are sitting on small losses, please consider keeping a Physical Stop Loss Order. You have to define how much of your capital you are willing to lose: 5%, 10%, 15% or whatever you decide it should be. 

A famous trader once said, "Cutting your losses is like performing surgery on one hand using your other".

Trust me, you will sleep better!

4. Wait on the sidelines for now, accumulate on cash in the meantime. 

No one can predict how long, how deep or how severe the markets could correct. 

Let the big institutional money take charge. We can then get in. Even if we are able to catch 50-70% of the next big upmove, we could make a lot of money.


PS: please enlarge all images for a better view. 

Monday, March 9, 2020

Ominous signs

My last post in this blog was in the summer of 2012. No, I didn't stop following the markets after that. While reading a good book on the stock markets, I read this interesting statement,
"Those who know, don't say. And those who say, don't know!"
Caught in the region between Don't Know and Don't Say, I decided not to post on this topic anymore.

The outbreak of Corona virus, has created unprecedented mayhem in the global markets. And the contagion has spread to Indian markets as well. Quite a lot of friends, relatives and colleagues whom I met over the last couple of weeks were saying, "The markets have fallen well. I will go and buy some!"

My only response to that, "Yeh tho trailer hain. Picture abhi baaki hain mere dost".
And that's why I reluctantly decided to post this based on the knowledge gained over the past few years. I could be hopelessly wrong in my analysis.
I hope I am!

Please enlarge the images to get a better view, till I find a better way to display them better!

The Indian markets have been in an Intermediate Term Uptrend (last 3-4 years).The upward slope in the trend line on the Nifty 50 weekly chart is an indication of that.


Likewise, we also see a near Long Term Uptrend(last 11-12 years). Again, the upward trend line on the Nifty 50 weekly chart(in log scale) indicates that.

So, are we in a downtrend?

From the various books I read and online material available, 3 rules define a change in trend.
Condition 1: Trend Line Break of the prevailing trend in the time frame considered.
Condition 2: Test of high( or low) and failure.
Condition 3:  Price breaks below the previous low.

Now let's zoom in a bit on the weekly charts and see what's happening in the Intermediate Term.


In the Long Term.


As of writing this post, only Condition 1 has been satisfied.
It needs to be seen if conditions 2 and 3 are satisfied. If any 2 of the 3 rules are satisfied, then the markets are in an Intermediate and near Long Term downtrend.

We are already in a confirmed Downtrend in the short term trend over the last one year.
Take a look at the Nifty daily charts over the last six months to one year.

And what does all this mean?

  • There is a lot more pain to come, for many years to come.  Please DON'T go and buy some!
  • Corona virus, Yes Bank, Oil price crash are all triggers for nervous markets. Just like the damage due to corona virus outbreak has been amplified multi fold due to social networks, the magnitude of selloffs is amplified by high frequency and algorithmic trading systems. 
  • The economy is screwed up. Everywhere!
  • Things are not as bad as they seem, they are worse.
  • Save up for the next big bull run - market patterns repeat. At the end of every downtrend, begins a new uptrend.
Though I can't say if it will be 6 months, 1 year, 2 or 3 years from now.

In this market...
The Bulls make money. 
The Bears make money. 
The Chickens also make some money.
Its only the Pigs which get slaughtered all the time!


Thursday, May 31, 2012

May 2012 update

Well, my updates are coming once every 2 month now. The reason being that I didn't have many notable trades  or great learning experiences in this time.

The markets i.e. both Indian and global were in an intermediate downtrend. "Sell in May and go away" was true even for this year. For some reason, there were not many good entry points for me to short. I tried to force some trades during quarterly results, with pretty disastrous consequences. But now I take my exit decisions a lot more quicker than before and try to head for the exit before it makes a bigger dent in my account.

More about the actual trades a little later.

First, let me talk about a book called, "The Best of Trader's Classroom by Jeffrey Kennedy " that I happened to come across on Elliot Wave International. It's a free book, but you need to sign up with EWI to get access to this book. Even signing up is for free. It's a very good and small book to read, to get new insights on trading. Mind you, since this book comes from a company that has Elliot Wave in its very name, you need to believe in Elliot Wave theory and Fibonacci retracements if you have to appreciate this book.

A lot of traders or wannabe traders don't believe in Elliot Wave theory. But since it has worked for me on most occasions, I use it in my trading setups extensively. But from my experience, I've seen that getting the waves right is very difficult most of the time. To this, the author suggests, "Wait for that trade that shows THE textbook wave pattern."

Here are some things that I learnt from that book.
1. Triangles : In one of my earlier posts I had mentioned about triangles : Symmetric Continuation, Descending, Ascending and so on. In this book, the author gives a very important piece of information.
"Triangles occur just before the last wave of a sequence, which means that triangles are found at Wave 4 or Wave B." And further says, "In your wave count analysis if you encounter triangles, think that the train's coming to the station."
When I back traced it to some of the stocks that I had seen triangles in the past year, I found this theory to be largely correct.
For most part of 2011, I had some bad trades which slowly chewed up my capital. This had me frustrated no ends and almost made me give up trading. In the book, he says triangles represent decay. Decay in time and decay of emotional capital. Now I understand my frustration.

2. Typical trade setup.
For a swing trader like me, this approach seemed very good. The trade entry strategy has 3 steps : Focus, Aim and Pull the Trigger. He says once you enter a trade, logic no longer applies. Everything is defined by two things : Fear and Greed.
He also mentions the 3 basic rules of Elliot Wave counting and how to place protective stops, which can be used to manage an ongoing trade.

Now coming to my trades.

It was a tumultuous period of 2 months. Small profits and equally small losses, almost always cancelling  each other out. Once I had to break the primary rule "Let the winner run", by closing a profitable trade in order to cover for slightly large losses in another trade. Ideally one position must be independent of the other. But that's practically possible when a bot that's trading and not a human that's trading.
In one of the trades, I lost a sizable profit to end up with a "No loss, no gain, but a lot of pain" trade simply because I didn't want to be a "Take your money and run" kind of trader.

But the last week changed everything. I had 2 good trades. When I mean good, I mean the really good text book trades. Here are the charts.

SBI: Wave 3 trade.


Ideally I would want to "Let the winner run". But I decided to play it safe due to GDP data news that was due and also F&O expiry.

Tata Motors: Wave C trade.


I was confident of my analysis on this one, but didn't want to take chances on the day of quarterly results. Hence, I took up just one lot before the results so that my risk was manageable. The results were supposedly not good, and was announced after market hours. This led to a gap down opening of 6% the next day. I sold another 2 lots and covered the same intraday with decent profits. The stock ended down by 12% that day.
I completely closed my position, once I saw the stock touching a retracement point on the weekly charts - supposedly a very strong support region.
But overall a great trade, the best trade for me ever - so far.

Hope to get some good trades in for the next update.

Happy trading!


Wednesday, April 4, 2012

March 2012 Update

Well, its been quite a while since I've been off the radar. There were quite a few reasons on the personal front for that. But there was one major trading reason for that. I successfully stayed in cash, i.e. without taking up a single trade for the whole month of January. That was a missed trading opportunity as most of the stocks went up by a lot in that period.

There were couple of reasons why I chose not to trade in that period.
1. The markets were in a continued downtrend for more than a year. And when it broke into an uptrend, I was sceptical about it, thinking that this is another wave of short covering. But I was wrong.
2. Mine is more of a swing trading system. There were hardly any pullbacks in most of the stocks that I followed. For example, at first look if you see Tata Motors, it unidirectionally went up all the way from 150 levels to 290 levels. Momentum trading scares me, and that's why I chose not to trade.

Staying in cash is also a strategy and I was happy to be in cash, as I saw my investment account go up bigtime. Most of my long term investment stocks which were in RED for more than a year did very well.

By end of January I was getting a feel of the market trend, and was able to sense that the short term uptrend was about to end. I quietly stood on the sidelines till the reversal occurred and took up a few short side trades. I even decided to hedge my investments to some extent.

For a change, I was correct in my approach and both my accounts were able to see some good profits. In the last 3 months, both my accounts have handsomely beaten the returns given by Nifty and Sensex, the benchmark indices.


Before I can come to my trades, I'd like to mention some useful links.
1. Google for Hakija.It's the best EOD data downloader for our markets available for free. Works well with Metastock.
2. Periodically go through Swing Trading Wiki. I certainly benefited a lot from this, and some of my trades were a direct result of my learnings from this website.

In this period I had some big winners, and fortunately equal number of small losers. Some mental aspects of trading that I adopted are :
1. If not confident, don't take up a position. Staying in cash is also a valid strategy.
2. Cut the losses and let the winners run. Corollary to this, "When in a trade, and if not confident due to market conditions after entering the trade, then exit with small losses."

I had some winners in LT(traded twice), Yes Bank, SBI, Nifty, Tata Motors. The first two being big ones.
I wish I had a better exit in LT (the second time around), SBI and Tata Motors. I was going off on a long trip, away from places with reliable internet connections. So I had to close them at smaller profits.

There's one pattern that I've traded with good degree of success. That's the Shooting Star pattern in an overbought region. I've shown two charts where I was able to find this and trade with success.

LT:


Tata Motors:


Recently, the Swing Trade Wiki was updated. And I found Top 10 price action tips, a great article on 10 top price action patterns that swing traders can use. I found one such pattern called "Gap and Trap" in Yes Bank and was able to have a big winner(by my standards) in that.


And I had some small losers too in Tata Motors, LIC Housing Finance, Yes Bank, TCS.
They were mostly due to bad entry points, where I jumped the gun and quickly got stopped out. In case of Tata Motors, I chanced a re entry slightly later and then made decent profits in the trade.
No regrets with the losers this time, as such trades are bound to happen. I was just happy that my losses were small and I was able to quickly move on from those trades.

I hope this trading form continues for a while. Hope to update again sometime soon with some interesting charts.

Bye and Happy Trading!