My last post in this blog was in the summer of 2012. No, I didn't stop following the markets after that. While reading a good book on the stock markets, I read this interesting statement,
"Those who know, don't say. And those who say, don't know!"
Caught in the region between Don't Know and Don't Say, I decided not to post on this topic anymore.
The outbreak of Corona virus, has created unprecedented mayhem in the global markets. And the contagion has spread to Indian markets as well. Quite a lot of friends, relatives and colleagues whom I met over the last couple of weeks were saying, "The markets have fallen well. I will go and buy some!"
My only response to that, "Yeh tho trailer hain. Picture abhi baaki hain mere dost".
And that's why I reluctantly decided to post this based on the knowledge gained over the past few years. I could be hopelessly wrong in my analysis.
I hope I am!
Please enlarge the images to get a better view, till I find a better way to display them better!
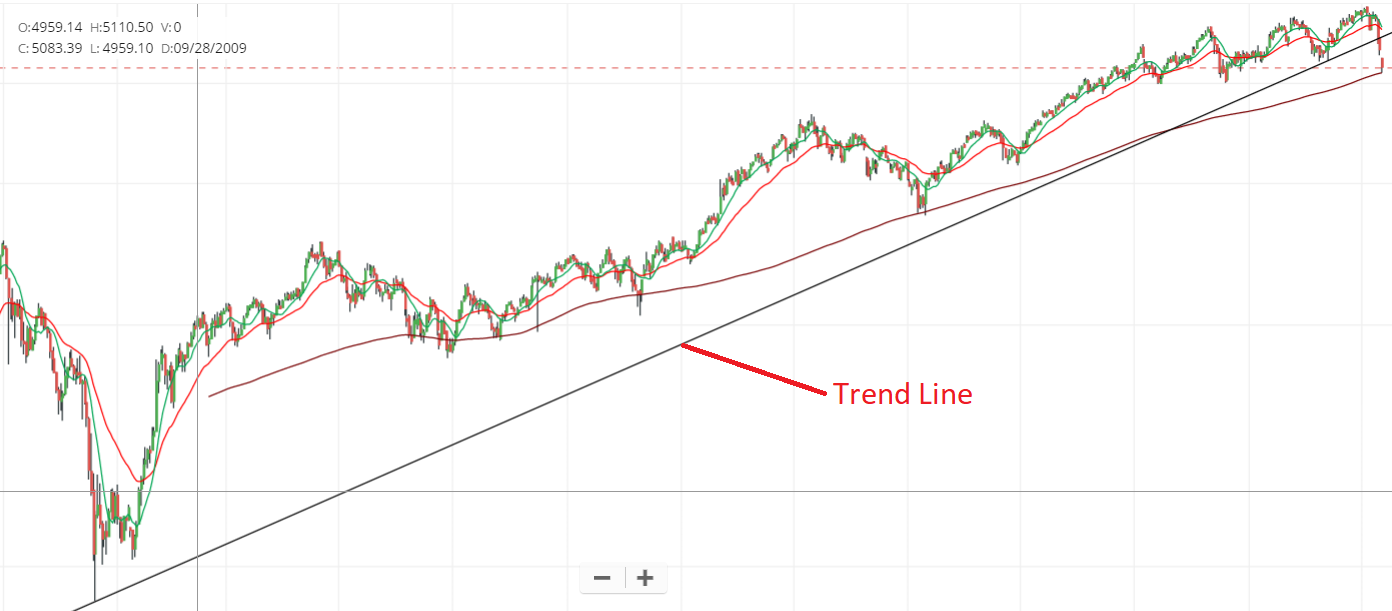
The Indian markets have been in an Intermediate Term Uptrend (last 3-4 years).The upward slope in the trend line on the Nifty 50 weekly chart is an indication of that.

Likewise, we also see a near Long Term Uptrend(last 11-12 years). Again, the upward trend line on the Nifty 50 weekly chart(in log scale) indicates that.

So, are we in a downtrend?
From the various books I read and online material available, 3 rules define a change in trend.
Condition 1: Trend Line Break of the prevailing trend in the time frame considered.
Condition 2: Test of high( or low) and failure.
Condition 3: Price breaks below the previous low.
Now let's zoom in a bit on the weekly charts and see what's happening in the Intermediate Term.

In the Long Term.

As of writing this post, only Condition 1 has been satisfied.
It needs to be seen if conditions 2 and 3 are satisfied. If any 2 of the 3 rules are satisfied, then the markets are in an Intermediate and near Long Term downtrend.
We are already in a confirmed Downtrend in the short term trend over the last one year.
Take a look at the Nifty daily charts over the last six months to one year.

And what does all this mean?
"Those who know, don't say. And those who say, don't know!"
Caught in the region between Don't Know and Don't Say, I decided not to post on this topic anymore.
The outbreak of Corona virus, has created unprecedented mayhem in the global markets. And the contagion has spread to Indian markets as well. Quite a lot of friends, relatives and colleagues whom I met over the last couple of weeks were saying, "The markets have fallen well. I will go and buy some!"
My only response to that, "Yeh tho trailer hain. Picture abhi baaki hain mere dost".
And that's why I reluctantly decided to post this based on the knowledge gained over the past few years. I could be hopelessly wrong in my analysis.
I hope I am!
Please enlarge the images to get a better view, till I find a better way to display them better!
The Indian markets have been in an Intermediate Term Uptrend (last 3-4 years).The upward slope in the trend line on the Nifty 50 weekly chart is an indication of that.

Likewise, we also see a near Long Term Uptrend(last 11-12 years). Again, the upward trend line on the Nifty 50 weekly chart(in log scale) indicates that.
So, are we in a downtrend?
From the various books I read and online material available, 3 rules define a change in trend.
Condition 1: Trend Line Break of the prevailing trend in the time frame considered.
Condition 2: Test of high( or low) and failure.
Condition 3: Price breaks below the previous low.
Now let's zoom in a bit on the weekly charts and see what's happening in the Intermediate Term.

In the Long Term.

As of writing this post, only Condition 1 has been satisfied.
It needs to be seen if conditions 2 and 3 are satisfied. If any 2 of the 3 rules are satisfied, then the markets are in an Intermediate and near Long Term downtrend.
We are already in a confirmed Downtrend in the short term trend over the last one year.
Take a look at the Nifty daily charts over the last six months to one year.

And what does all this mean?
- There is a lot more pain to come, for many years to come. Please DON'T go and buy some!
- Corona virus, Yes Bank, Oil price crash are all triggers for nervous markets. Just like the damage due to corona virus outbreak has been amplified multi fold due to social networks, the magnitude of selloffs is amplified by high frequency and algorithmic trading systems.
- The economy is screwed up. Everywhere!
- Things are not as bad as they seem, they are worse.
- Save up for the next big bull run - market patterns repeat. At the end of every downtrend, begins a new uptrend.
In this market...
The Bulls make money.
The Bears make money.
The Chickens also make some money.
Its only the Pigs which get slaughtered all the time!